Share
Machine Learning in Econometrics: Methods And Use Cases

- BLOG
- Artificial Intelligence
- February 7, 2026
Economists like models that behave neatly on paper. Real-world data rarely cooperates. Inflation surprises, markets overreact, and your “simple” regression suddenly needs 200 controls, three interaction terms, and a bit of luck. That’s exactly why machine learning in econometrics has become a practical necessity.
Instead of forcing economic reality into rigid assumptions, machine learning helps you work with complexity. It handles high-dimensional variables, captures nonlinear patterns, and improves forecasting without pretending the world is perfectly linear.
In this blog, you’ll get a clear view of where ML fits inside econometrics, which problems it solves best, and what makes it work in real datasets. You’ll also see the mistakes that quietly ruin results, even when the model looks perfect.
Contents
- 1 What is Machine Learning in Econometrics?
- 2 Econometrics vs Machine Learning: What’s the Real Difference?
- 3 Turn econometric data into reliable ML models with Webisoft.
- 4 Econometric Problems Machine Learning Solves Best
- 5 Core Machine Learning Methods Used in Econometrics
- 6 Real-World Applications of Machine Learning in Econometrics
- 7 Machine Learning for Causal Inference in Econometrics
- 8 Practical Workflow: How to Build an Econometrics + ML Model
- 8.1 Step 1: Define the econometric task and target
- 8.2 Step 2: Build a clean dataset aligned to the decision
- 8.3 Step 3: Create features economists expect
- 8.4 Step 4: Choose a split strategy that matches the data structure
- 8.5 Step 5: Set baselines before ML
- 8.6 Step 6: Train and tune with leak-resistant validation
- 8.7 Step 7: Evaluate with the right yardstick
- 8.8 Step 8: Make results interpretable enough for economic use
- 8.9 Step 9: Document, monitor, and refresh
- 9 When Machine Learning Fails in Econometrics
- 10 Common Pitfalls When Using Machine Learning in Econometrics
- 11 Building Reliable Econometric ML Models With Webisoft
- 12 Turn econometric data into reliable ML models with Webisoft.
- 13 Conclusion
- 14 Frequently Asked Question
What is Machine Learning in Econometrics?
Machine learning in econometrics is the use of ML methods inside the econometric toolbox to handle prediction and estimation problems where classic models struggle. It is most useful when you have many predictors, complex nonlinear patterns, or weak guidance on the right functional form.
In practice, it usually shows up in two ways. First, ML is used for stronger prediction, such as forecasting outcomes from rich datasets. Second, ML is used as a supporting step in causal work, where it estimates high dimensional “nuisance” parts while econometric theory protects the causal target.
The point is not to replace econometrics. The point is to pair ML’s flexible fitting with econometrics’ focus on identification, inference, and credible conclusions from data.
Econometrics vs Machine Learning: What’s the Real Difference?
 Econometrics and machine learning often use similar mathematical tools, but they serve different purposes. Econometrics is designed to explain economic relationships with credible inference.
Machine learning is designed to predict outcomes accurately on unseen data. That difference shapes everything else.
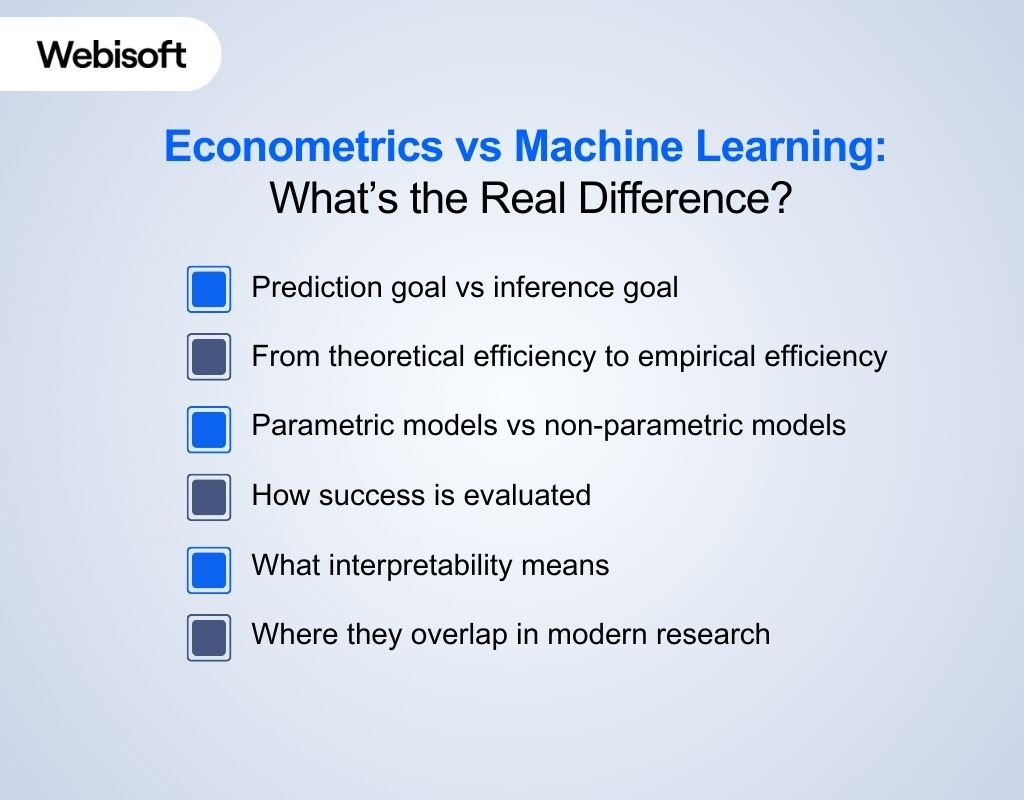
Prediction goal vs inference goal
- Econometrics: The main goal is to estimate relationships you can interpret, such as the causal effect of education on income or interest rates on inflation. The focus is on inference, meaning coefficients, uncertainty, and hypothesis tests matter.
- Machine learning: The main goal is predictive accuracy, such as forecasting GDP growth or classifying default risk. A model can be valuable even if its internal parameters are not interpretable in a causal sense.
From theoretical efficiency to empirical efficiency
- Econometrics: Built around theoretical efficiency, where estimators are optimal if assumptions hold. Parametric models are specified using theory, and methods like OLS are efficient under linearity, exogeneity, and homoskedasticity.
- Machine learning: Shifts toward empirical efficiency when those assumptions break down. Models are judged by out-of-sample performance and practical accuracy, even when theory is incomplete or the data-generating process is unknown.
Parametric models vs non-parametric models
- Econometrics: Relies mainly on parametric or semi-parametric models with predefined functional forms. This supports interpretation and inference, but performance suffers when the model is misspecified.
- Machine learning: Relies more on non-parametric or highly flexible models that learn structure from data. This reduces functional form risk and captures nonlinearities, but requires more data and careful validation.
How success is evaluated
- Econometrics: Success is judged by whether estimates are credible and stable, supported by confidence intervals, robustness checks, and clear interpretation under assumptions.
- Machine learning: Success is judged by how well the model performs out of sample, typically measured through cross validation and prediction error metrics like RMSE or MAE.
What interpretability means
- Econometrics: Interpretability means coefficients have economic meaning, such as a one-unit change in X leading to an expected change in Y, often with a causal framing.
- Machine learning: Interpretability usually means explaining model behavior, such as which variables drive predictions or how predictions change when inputs shift, without automatically claiming causality.
Where they overlap in modern research
- Econometrics: Modern econometrics increasingly uses ML to estimate complex components like propensity scores or outcome models. While still targeting valid causal inference through frameworks such as double/debiased ML.
- Machine learning: ML benefits from econometric thinking when the goal is decision-making. It forces clarity about what is being estimated, what assumptions are required, and what conclusions are valid.


Turn econometric data into reliable ML models with Webisoft.
Book a free consultation to build forecasting and causal systems!
Econometric Problems Machine Learning Solves Best
 Once you understand how econometrics and machine learning differ, the next step is knowing where ML adds the most value. In econometric work, ML is most useful when traditional models struggle with complexity, scale, or weak functional form assumptions.
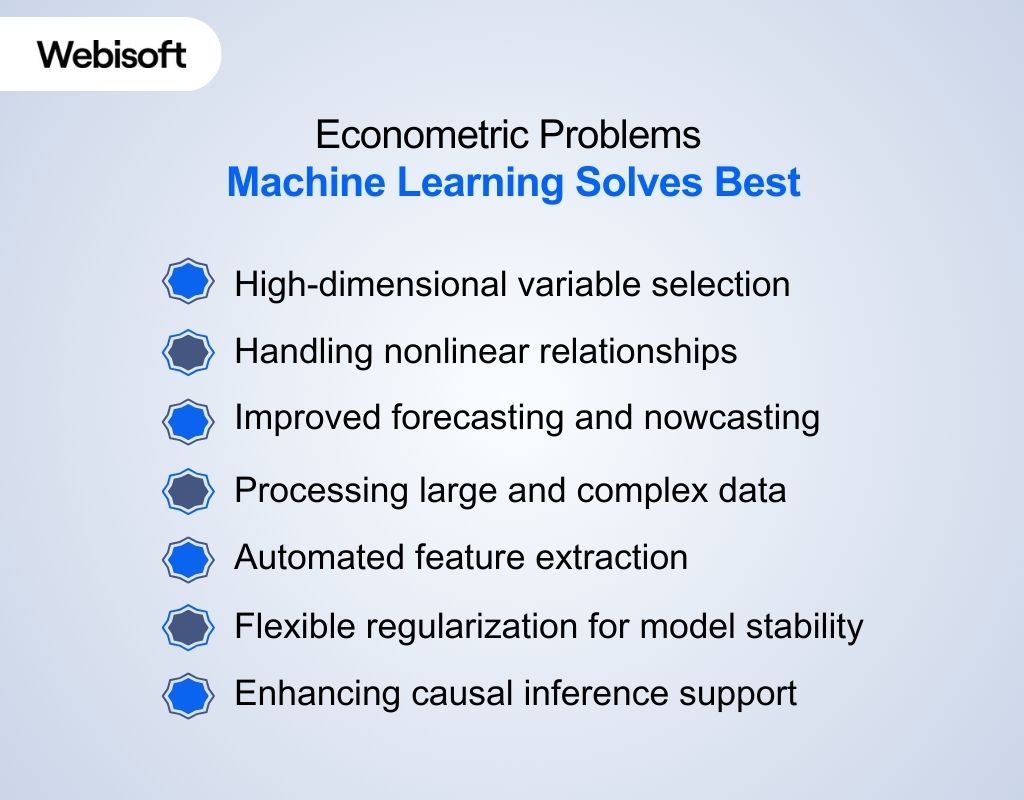
High-dimensional variable selection
Machine learning methods like LASSO and Elastic Net help select relevant predictors when variables are too many. They reduce noise and prevent overfitting in high-dimensional datasets. This is useful when traditional econometric regression becomes unstable due to too many controls.
Handling nonlinear relationships
Many economic relationships are nonlinear and depend on interactions between variables. Tree-based models and neural networks can capture these patterns without manually specifying the functional form.
This reduces model misspecification risk, which is common in purely linear econometric models.
Improved forecasting and nowcasting
Machine learning performs well when forecasting accuracy is the main goal. It can combine many predictors to forecast inflation, GDP, unemployment, or demand more effectively.
Cross-validation and ensemble learning help ensure the model generalizes well to new time periods.
Processing large and complex data
Economic datasets are no longer limited to clean spreadsheets and structured tables. Machine learning can process large volumes of messy, high-frequency, multi-source data efficiently.
It also supports unstructured inputs like text, news, earnings reports, and sentiment indicators.
Automated feature extraction
Machine learning can extract useful signals from raw data with less manual engineering. For example, it can learn patterns from time series, text data, and complex categorical variables. This helps econometricians build stronger models with less trial-and-error feature design.
Flexible regularization for model stability
Regularization methods like Ridge and LASSO improve model stability when predictors are correlated. They shrink coefficients to reduce variance and control overfitting. This is important in econometrics, where multicollinearity can weaken regression estimates and inflate uncertainty.
Enhancing causal inference support
Machine learning supports causal econometrics by estimating nuisance components more accurately. It can model propensity scores and outcome functions in complex, high-dimensional settings. Econometric identification still drives validity, but ML improves estimation quality within that structure.
Core Machine Learning Methods Used in Econometrics
Not every ML algorithm is useful in economic modeling. In practice, a few machine learning methods in econometrics dominate because they handle real-world economic data, many predictors, and cross-validation benchmarking reliably.
- Regularized regression (LASSO, Ridge, Elastic Net): Used when datasets contain many predictors and multicollinearity is common. These models control overfitting and improve stability. LASSO is also widely used for variable selection in high-dimensional econometric settings.
- Tree-based models (Decision Trees, Random Forests): Useful for capturing nonlinear relationships and interactions without specifying a functional form. Random forests often serve as strong prediction baselines. They are also used to estimate nuisance functions in causal ML pipelines.
- Boosting methods (Gradient Boosting, XGBoost-style models): Chosen when prediction accuracy matters and relationships are complex. Boosted trees can capture subtle nonlinear patterns better than single trees. They are commonly used in forecasting and high-dimensional prediction tasks.
- Kernel methods and Support Vector Machines (SVM): Often used for classification and nonlinear regression when datasets are moderate in size. Kernels allow flexible decision boundaries without building deep models. These methods remain part of the standard supervised learning toolkit in econometric ML discussions.
- Neural networks (Deep Learning): Applied when economic relationships are highly nonlinear or when data is unstructured. This includes text, images, or large-scale signals from news and filings. Economists typically use neural nets for prediction, not direct causal interpretation.
- Unsupervised learning (Clustering, PCA, Factor Models): Used to reduce dimensionality and summarize large datasets into interpretable economic signals. Clustering helps segment markets or behavior patterns. PCA and factor models help compress many indicators into a few drivers.
- Matrix completion and recommendation-style methods: Useful when economic data is missing in structured ways, especially in panel-style datasets. These methods help recover missing values and learn latent structure. They are common in consumer, product, and platform datasets.
Real-World Applications of Machine Learning in Econometrics
 Once you know the main tools economists use, the next question is where they deliver real results. In applied work, machine learning supports econometrics in forecasting, measurement, and causal evaluation, especially when datasets are large or signals are noisy.
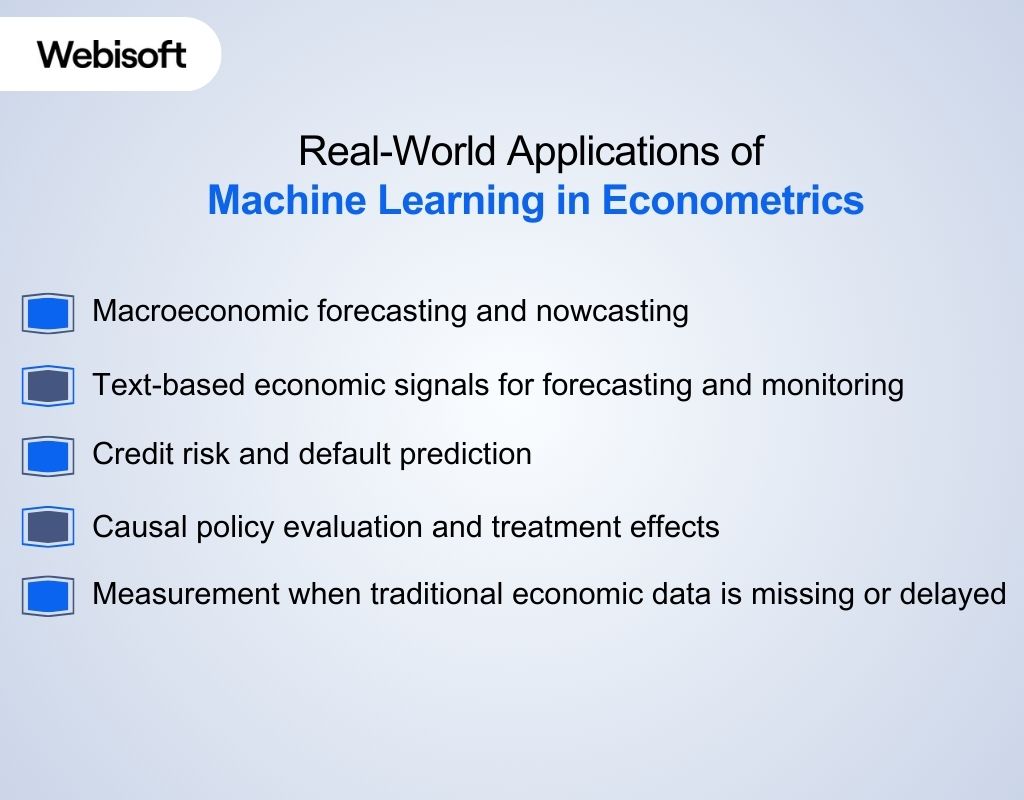
Macroeconomic forecasting and nowcasting
ML is used to forecast or nowcast macro variables when there are many predictors, mixed frequencies, or fast-changing conditions. Current work also tests when ML helps and when classic econometric nowcasting still wins, which keeps expectations realistic.
Text-based economic signals for forecasting and monitoring
Economists turn news, filings, and other text into numeric indicators that can improve forecasting and tracking. This includes “text as data” approaches that convert narrative information into features, then link them to outcomes like growth, inflation, or market moves.
Credit risk and default prediction
Credit risk is a major applied area where ML models support default prediction using borrower, firm, and macro indicators. Research highlights practical issues like feature selection and model tuning because small gains in prediction can affect capital planning and lending decisions.
Causal policy evaluation and treatment effects
In program evaluation, ML is used to estimate parts of a causal model more flexibly, then econometric logic is used to interpret effects. Recent econometrics work revisits well-known studies using tools like double machine learning and causal forests to study average and heterogeneous treatment effects.
Measurement when traditional economic data is missing or delayed
When official indicators are unavailable or slow, ML can combine alternative data sources to estimate economic activity. For example, research uses satellite data with ML to help estimate or nowcast real GDP when standard data coverage is weak.
Machine Learning for Causal Inference in Econometrics
 Causal econometrics asks “what changed what,” not “what predicts what.” Machine learning in econometrics helps when confounders, controls, or relationships are complex. It does not replace identification. It supports it with better estimation in high-dimensional settings.
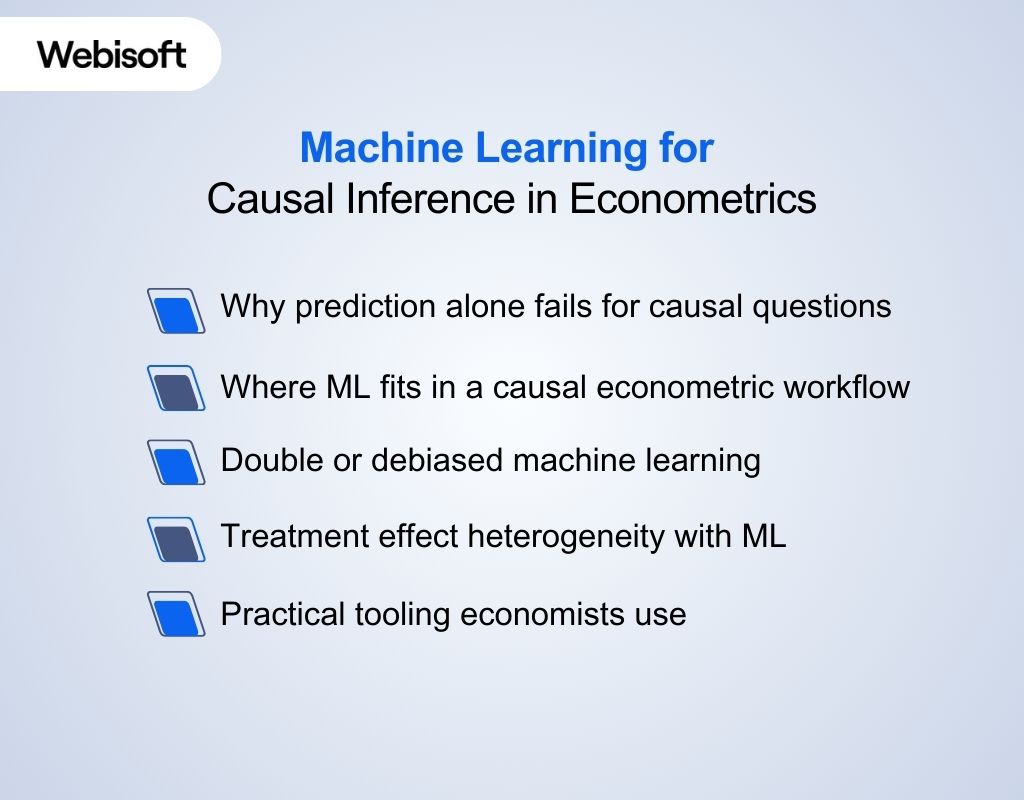
Why prediction alone fails for causal questions
A model can predict outcomes well and still miss the causal effect you care about. That happens because prediction can absorb patterns from confounding variables. Causal inference needs a target, plus assumptions that connect data to that target.
Where ML fits in a causal econometric workflow
In many causal setups, you must estimate “nuisance” parts before estimating the causal parameter. Examples include outcome models and propensity scores. ML is useful here because it can handle many covariates and nonlinearities.
Double or debiased machine learning
Double machine learning is a common approach for causal parameters when there are many controls. It combines ML for nuisance estimation with techniques that reduce bias from regularization. Cross-fitting is used so the same data do not both train and evaluate the key step.
Treatment effect heterogeneity with ML
Economists often want to know who benefits most from a policy or intervention. Methods built on trees can estimate heterogeneous treatment effects across subgroups. This supports targeting decisions, while keeping inference goals in view.
Practical tooling economists use
In Python, libraries like EconML implement DML and causal forests with inference features. DoWhy helps structure causal analysis around identification and diagnostic checks. These tools support applied workflows, but they still rely on valid research design.
Practical Workflow: How to Build an Econometrics + ML Model
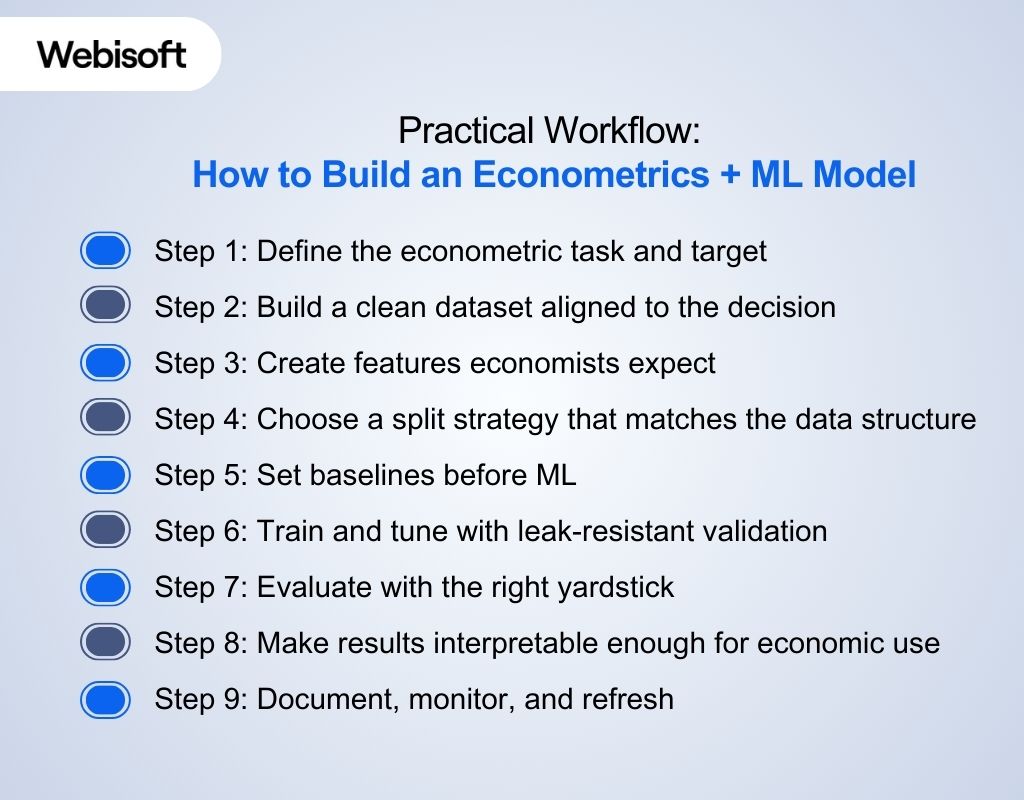 A solid workflow matters more than the algorithm choice in applied econometrics. Machine learning techniques in econometrics work best when you define the target clearly, prevent leakage, and benchmark against simple baselines. The steps below keep results credible and usable.
Step 1: Define the econometric task and target
Decide if you are doing a prediction, measurement, or a causal estimate. Write the outcome, unit of analysis, and time horizon. This prevents building a high-scoring model that answers the wrong question.
Step 2: Build a clean dataset aligned to the decision
Lock the time index, define the observation window, and document missingness. For panels, define the entity key and make sure features only use information available at that time.
Step 3: Create features economists expect
Add lags, growth rates, seasonal indicators, and policy or shock markers. For panels, separate time-varying features from stable entity attributes. Keep a simple feature log so results are reproducible.
Step 4: Choose a split strategy that matches the data structure
Do not randomly shuffle time series. Use time-ordered splits and test on later periods. For forecasting, use rolling or expanding windows to mimic real use.
Step 5: Set baselines before ML
Start with strong econometric baselines like OLS or a simple time-series benchmark. You need this to prove the ML model adds value, not just complexity.
Step 6: Train and tune with leak-resistant validation
Use TimeSeriesSplit in scikit-learn to apply time-series cross-validation while preserving the correct time order. It allows you to separate training and test periods with a buffer window, reducing leakage from closely timed observations. Tune only a small set of hyperparameters and keep the search bounded.
Step 7: Evaluate with the right yardstick
Track prediction errors on the held-out period and compare against baselines. Also check stability across folds and across regimes, since economic relationships can shift over time.
Step 8: Make results interpretable enough for economic use
Summarize which inputs move predictions and whether effects behave sensibly across periods. Keep interpretation claims aligned with the task. Do not imply causality unless the design supports it.
Step 9: Document, monitor, and refresh
Record the dataset version, feature set, split logic, and baseline comparison. If used in production, monitor drift and rerun backtests on recent windows before updating. Want to turn these econometric ML methods into models your team can actually use for forecasting and decision support? With Webisoft, you can build production-ready machine learning models backed by strong data pipelines, validation, and deployment support.
When Machine Learning Fails in Econometrics
Even when models are implemented carefully, machine learning can still fail in econometric settings for deeper, structural reasons. These failures are not coding mistakes or validation errors. They come from mismatches between what ML optimizes and what econometric analysis is actually trying to answer.
- Misaligned research questions: ML fails when the question is causal or structural, but the model is optimized only for prediction. High accuracy does not fix a poorly defined estimand.
- Weak or missing identification: No amount of model flexibility can recover causal effects without valid identification. If assumptions like exogeneity or parallel trends fail, ML cannot compensate.
- Economic meaning lost in flexibility: Highly flexible models can fit patterns that have no stable economic interpretation. This becomes a failure when results must inform policy, pricing, or strategic decisions.
- Overreliance on data without theory: ML struggles when models ignore economic theory entirely. Without theoretical guidance, models may learn spurious relationships that collapse outside the sample.
- Structural models replaced by black boxes: In settings that require structural parameters or counterfactual reasoning, ML can fail if it replaces, rather than supports, the underlying economic model.
- Decision-making without uncertainty awareness: ML fails in econometrics when outputs are treated as point predictions without acknowledging uncertainty, sensitivity, or assumption dependence.
Common Pitfalls When Using Machine Learning in Econometrics
Even with a clean workflow, machine learning in econometrics can fail for reasons that have little to do with the algorithm. The pitfalls below show up often in forecasting, panels, and causal work. Avoiding them keeps results believable and usable.
- Leakage from the future (time order broken): Models look “amazing” when future information slips into training through feature building or split design. This is a known failure mode in time-series evaluation, including deep learning setups.
- Random splits on panel or time data (invalid evaluation): Shuffling observations can mix entities and periods, so the test set stops being a real “future” or “new unit” check. Results often collapse when you move to truly later periods or new groups.
- Treating predictive success as a causal result: A model can predict well because it absorbs confounding patterns, not because it learned a causal effect. Causal claims still require identification logic, not just accuracy.
- Naive inference after ML (regularization and overfitting bias): Plugging ML estimates into a causal parameter and then reporting standard errors like OLS can be wrong. DML style approaches use orthogonal scores and cross-fitting to reduce these biases.
- Regime shifts and structural change (relationships move): Economic systems change after policy moves, crises, and tech shifts, so yesterday’s patterns stop holding. In ML terms, this is concept drift, and it can quietly break models in deployment.
- Benchmark neglect (no simple baselines): Without comparing to OLS or standard time-series baselines, it is easy to ship complexity that adds little value. Baselines also reveal when feature engineering matters more than model choice.
Building Reliable Econometric ML Models With Webisoft
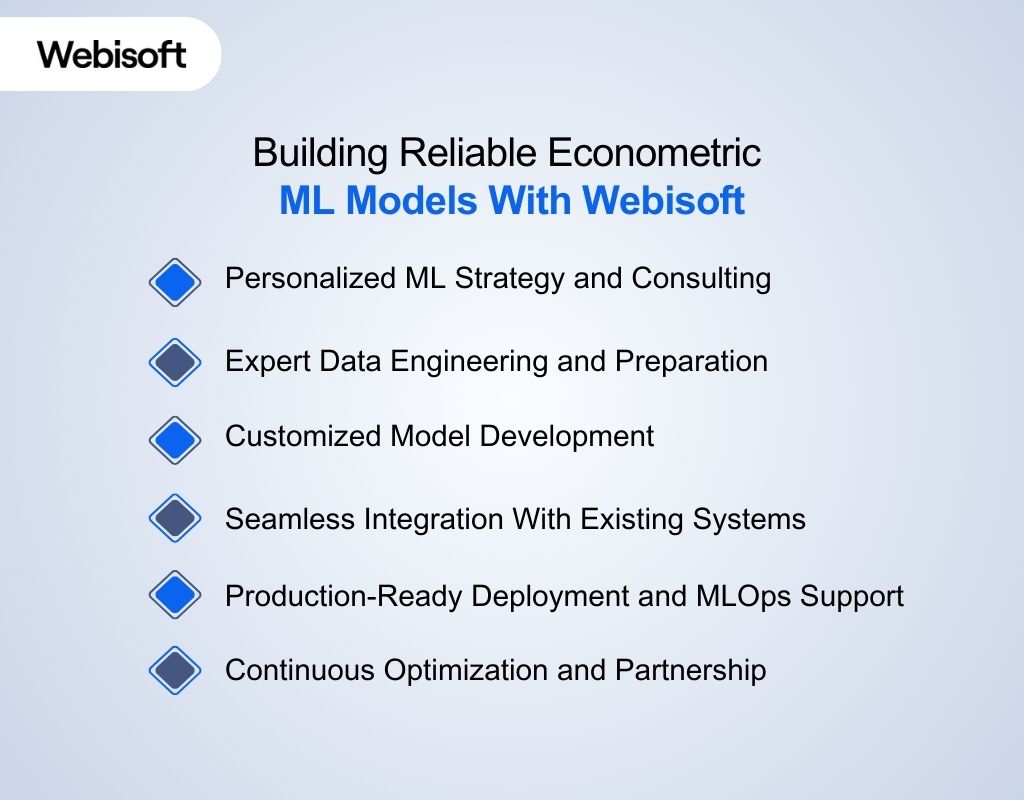 Once you move past theory, the real challenge is building econometric ML models you can actually trust in production. At Webisoft, we help you design, validate, and deploy models that stay reliable across noisy data, shifting trends, and changing economic regimes.
Personalized ML Strategy and Consulting
We begin by understanding your business objectives and data landscape, creating a clear roadmap that bridges economic insight with technical execution. Our strategy phase assesses data quality, use cases, and the right models so your investment delivers impact, not confusion.
Expert Data Engineering and Preparation
Reliable models start with reliable data. Our engineers design strong data pipelines that clean, transform, and structure your economic and business data for optimal learning. This reduces bias, supports interpretability, and minimizes the common data issues that derail ML projects.
Customized Model Development
We build ML models made for your specific econometric problems, whether forecasting trends, selecting features, or estimating complex relationships. Our team uses advanced frameworks and techniques to match model choice to your objectives, not one-size-fits-all solutions.
Seamless Integration With Existing Systems
Your econometric models should work in the real world, not in isolation. We integrate ML systems with your current software, from analytics dashboards to forecasting tools, ensuring predictions and insights flow directly into your workflows without disruption.
Production-Ready Deployment and MLOps Support
Deploying a model is just the start. We set up automated monitoring and retraining pipelines so your ML systems stay accurate as data evolves. This keeps performance strong through changing conditions and prevents silent drift over time.
Continuous Optimization and Partnership
Our engagement doesn’t end at launch. We track performance, refine models, and ensure your solution continues to align with business goals. With Webisoft’s ongoing support, your econometric ML models remain reliable, interpretable, and tied to measurable results. Ready to move from experiments to reliable econometric ML systems? Connect with Webisoft and we’ll help you build models with clean data pipelines, strict validation, and production monitoring so your forecasts and causal insights remain dependable:
Turn econometric data into reliable ML models with Webisoft.
Book a free consultation to build forecasting and causal systems!
Conclusion
Machine learning in econometrics is most valuable when it stays grounded in the econometric mindset. Strong models are not just the ones that fit well, but the ones that survive messy data, shifting regimes, and real-world scrutiny. When you use ML with clear targets and disciplined validation, it stops being “just another model” and becomes a reliable decision tool. That is exactly the kind of work we do at Webisoft. We build econometric ML systems the right way from day one. That includes clean pipelines, rigorous validation, and deployment-ready models that stay reliable over time.
Frequently Asked Question
Is machine learning accepted in academic econometrics research?
Yes. Many top economics and econometrics journals publish ML-based studies, especially in forecasting, variable selection, and causal inference. Methods like DML and causal forests are widely used because they combine flexible estimation with econometric inference discipline.
How do you handle missing data in econometric ML projects?
Missing data can be handled through imputation, model-based estimation, or algorithms that tolerate missing values. The right approach depends on whether missingness is random or systematic. Always test sensitivity, since missingness can bias econometric conclusions.
How much data do you need for ML in econometrics?
Data needs depend on model complexity and noise levels, but ML usually requires more observations than classic regressions. Flexible models need larger samples to avoid overfitting. In small datasets, simpler models or regularization often perform better.
